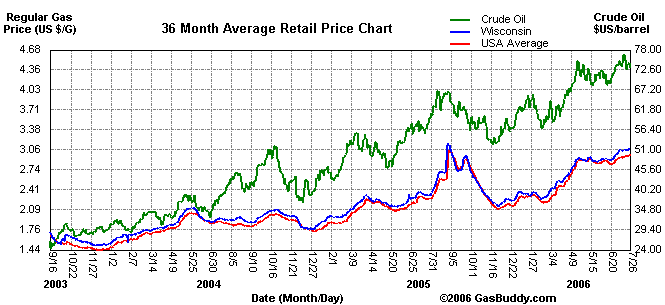
I've mentioned GasBuddy.com before and its nifty U.S. gasoline "temperature" map. Another feature of the site is a dynamic graph of gas prices. The sample I show here is for a three year period. It shows the average price of a gallon of gasoline in the U.S. (in red) as well as the average price in Wisconsin (in blue) and the crude oil price per barrel (in green).
As you can see, the average price in Wisconsin has followed the average national price very closely, sometimes above, sometimes below. It isn't anything like the average price in, say, Los Angeles. Matter of fact, lets have another graph so that we can laugh at the Angelinos and their predicament!

No comments:
Post a Comment